Posts

A Frequentist and a Bayesian go to a bar ...

(Note: you might want to refresh this page on your browser if the equations don't render correctly.)  In the first installment of this blogpost , I illustrated that Fisher's rule of thumb of using $\frac{3}{n}$ for the upper limit of a 95% confidence/credible interval is a good approximation as soon a $n>=25$. This was inspired by a blogpost from John D. Cook on the subject. At the end I made a remark about something odd that happens when $n=1$. Fisher's rule of thumb results in 1, which is not very informative. The Bionomial solution is 0.95. When $n=1$ this is now an actual Bernoulli, i.e. a special case of the binomial if you will: $$P(S_1=0)= {1\choose 0}p^0(1-p)^1=0.05$$ $$= 1(1-p)=0.05$$ $$p=1-0.05=0.95.$$ Yet, in the Bayesian analysis, the result is p=0.78. Why? First let's recalculate that number in an even simpler manual way than I showed in the first installment of this blogpost. We know that the distribution we're interested in is the Bernoulli distri...

A note on observing zero successes

Image
Say that you have a sample of size $n=1000$ and you observed $S_n=100$ successes. Traditionally you would use $\hat p=\frac{S_n}{n}=\frac{100}{1000}=0.1$ as a point estimate of the population proportion $p$. From a frequentist perspective you would probably also report a confidence interval: $$p_-=\hat p - z_\alpha\sqrt{\frac{\hat p(1-\hat p)}{n}}=0.1-1.96\sqrt{\frac{0.1 \times 0.9}{1000}}=0.08140581,$$ and $$p_+=\hat p + z_\alpha\sqrt{\frac{\hat p(1-\hat p)}{n}}=0.1-1.96\sqrt{\frac{0.1 \times 0.9}{1000}}=0.1185942,$$ using $z_\alpha=1.96$ for a 95% confidence interval (Assuming that the sample fraction is small, i.e. the universe size $N$ is large relative to $n$. Also, I will not go into how such a confidence interval needs to be interpreted.). So far, so good.  Now say you have observed zero successes, i.e. $S_n=0$, and you want to apply the procedure above. To start with, you can't because it violates the non-zero sample proportion assumption.   There are some alterna...

A simple R/Shiny app to illustrate two properties of means and medians

 Recently I saw two interesting discussions on Twitter that had to do with means and medians and the relationship between both. Both were in Dutch. The first one was between Casper Albers (@CaAl) and Zihni Özdil (@ZihniOzdil) about student loans (see here ). The bottomline is dat Casper Albers reminded us that a positive stochastic variable can never have a median that is more than twice the mean. The second discussion was between Joël De Ceulaer (@jdceulaer), Karel Anthonissen (@KAnthonissen),  Youssef Kobo (@Youssef_Kobo) and Koen Fillet (@filletk) about young people buying houses and the support they get from their parents (see here ). That discussion also involved means and medians.  I mentioned that if a distribution has a finite variance, the absolute value of the difference between mean and median is at most equal to the standard deviation  (see here ).  These two properties are not well know and suprising to some. I will admit that I only learned about t...

Opmerkingen bij kadering statistische resultaten van de Grote Coronastudie

Image
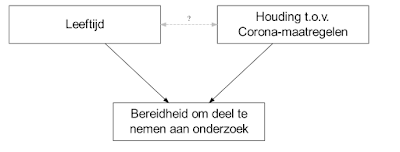
 Inleiding Enkele weken geleden hebben Thomas Neyens (UHasselt & KU Leuven), Jonas Crèvecoeur (UHasselt & KU Leuven), Niel Hens (UHasselt & UAntwerpen), Geert Molenberghs (UHasselt & KU Leuven), Koen Pepermans (UAntwerpen), Jan Aerts (UHasselt), Pierre Van Damme (UAntwerpen), Philippe Beutels (UAntwerpen) een lang verwachte kadering van de statistische resultaten van de Grote Coronastudie (GCS) gepubliceerd.  De eerste bladzijden lezen als een beknopte inleiding in kwantitatieve onderzoeksmethoden. Alleen daarom al, loont het de moeite om het stuk van Neyens, Crèvecoeur, Hens et al. (2021) te lezen. Met name voor niet-specialisten is dit zeer lezenswaardig. De auteurs slagen er in om in enkele paragrafen en in een eenvoudige taal wegwijs te maken in de verschillende onderzoeksmethoden.   Daarna wordt de GCS in dit kader geplaatst en van naderbij bekeken. Samengevat is de GCS is een observationele, niet-probabilistische survey die cross-sectioneel gebr...

Beware of the constrictive data science pyramid!

I tried writing on Medium. It features data science, constrictive pyramids and carpentry, but essentially it's about #HR in #Tech 😎. Here 's the result. Regards, Istvan

Tijd voor een noodsteekproef

Image
In De Morgen van 23 juni 2020 doet Paul De Grauwe een oproep om mondmaskers in alle publieke ruimtes waar de afstandsregel niet kan worden gerespecteerd te verplichten. Zijn pleidooi is gebaseerd op de observatie dat de aanbeveling die tot dan gold onvoldoende is gebleken.  Ik steun de oproep van De Grauwe volledig. Op 2 juli meldde De Morgen dat volgens de Grote Coronastudie van de universiteiten van Antwerpen, Hasselt en Leuven en de ULB, 77 procent van de Belgen mondmaskers wil verplichten in de supermarkt. Deze twee observaties zijn niet noodzakelijk tegenstrijdig. Het zou kunnen dat tussen 23 juni en 2 juli de publieke opinie veranderd is. Het zou ook kunnen dat  mensen het 'wederkerig altruïsme' argument van De Grauwe goed begrepen hebben en zich realiseren dat enkel verplichting mensen (inclusief zichzelf) zal aanzetten tot het dragen van een mondmasker. Een andere mogelijkheid is dat de observaties wel tegenstrijdig zijn en dat (minstens) één van de twee fout i...

Data Science trends

Wrote a LinkedIn article on the trends I see in data science. You can find it here .